Demand Estimation for Dockless Bike-Share
Bike-Share Demand Model
Cities such as Providence, RI rely on bike-share trip data that provides an incomplete signal of true rider demand. If someone opens the app and no bike is nearby, no trip is observed. If a rider walks several blocks before starting a ride, the recorded location only reflects nearby demand.
To plan fleet size, rebalancing strategies, or set equity requirements, a city needs to know where riders are truly coming from.
Approach
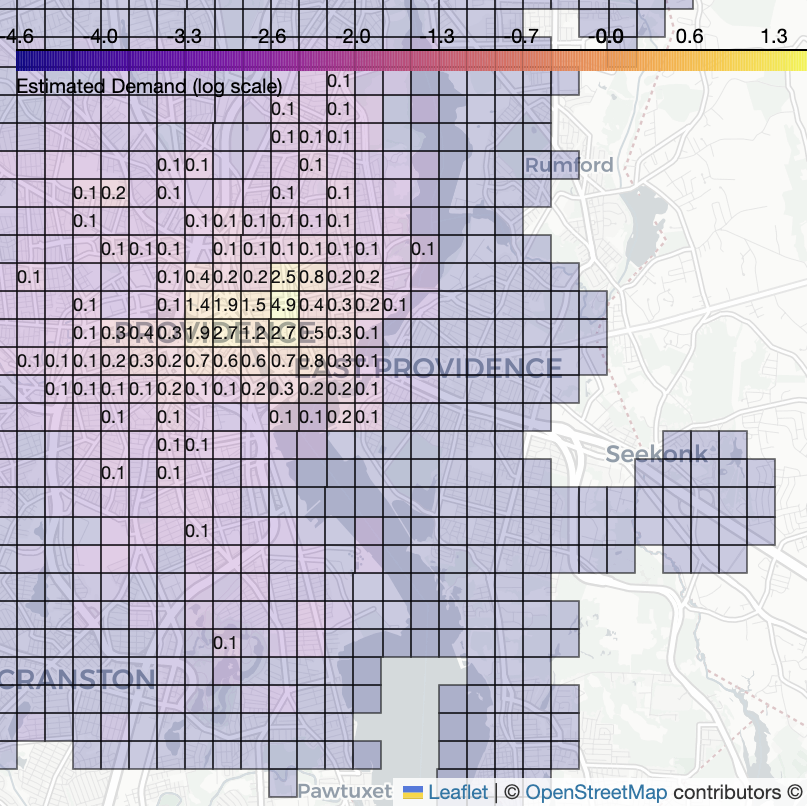
Instead of treating observed trips as true demand, we model demand as a hidden spatial and temporal arrival process. We divide the city into grid cells, model how riders most likely behave when they look for a bike (for example, choosing the nearest one), and treat each recorded trip as the result of both user intent and local bike availability.
To infer the most likely arrival rates, I designed and implemented an Expectation–Maximization algorithm. The outcome is an interpretable map of user demand where each gridcell contains its average user arrival rates.
Result
Alongside mathematical derivation, I engineered the full data pipeline from raw trip data pre-processing to demand visualization. I validated the approach with a test suite and synthetic experiments.
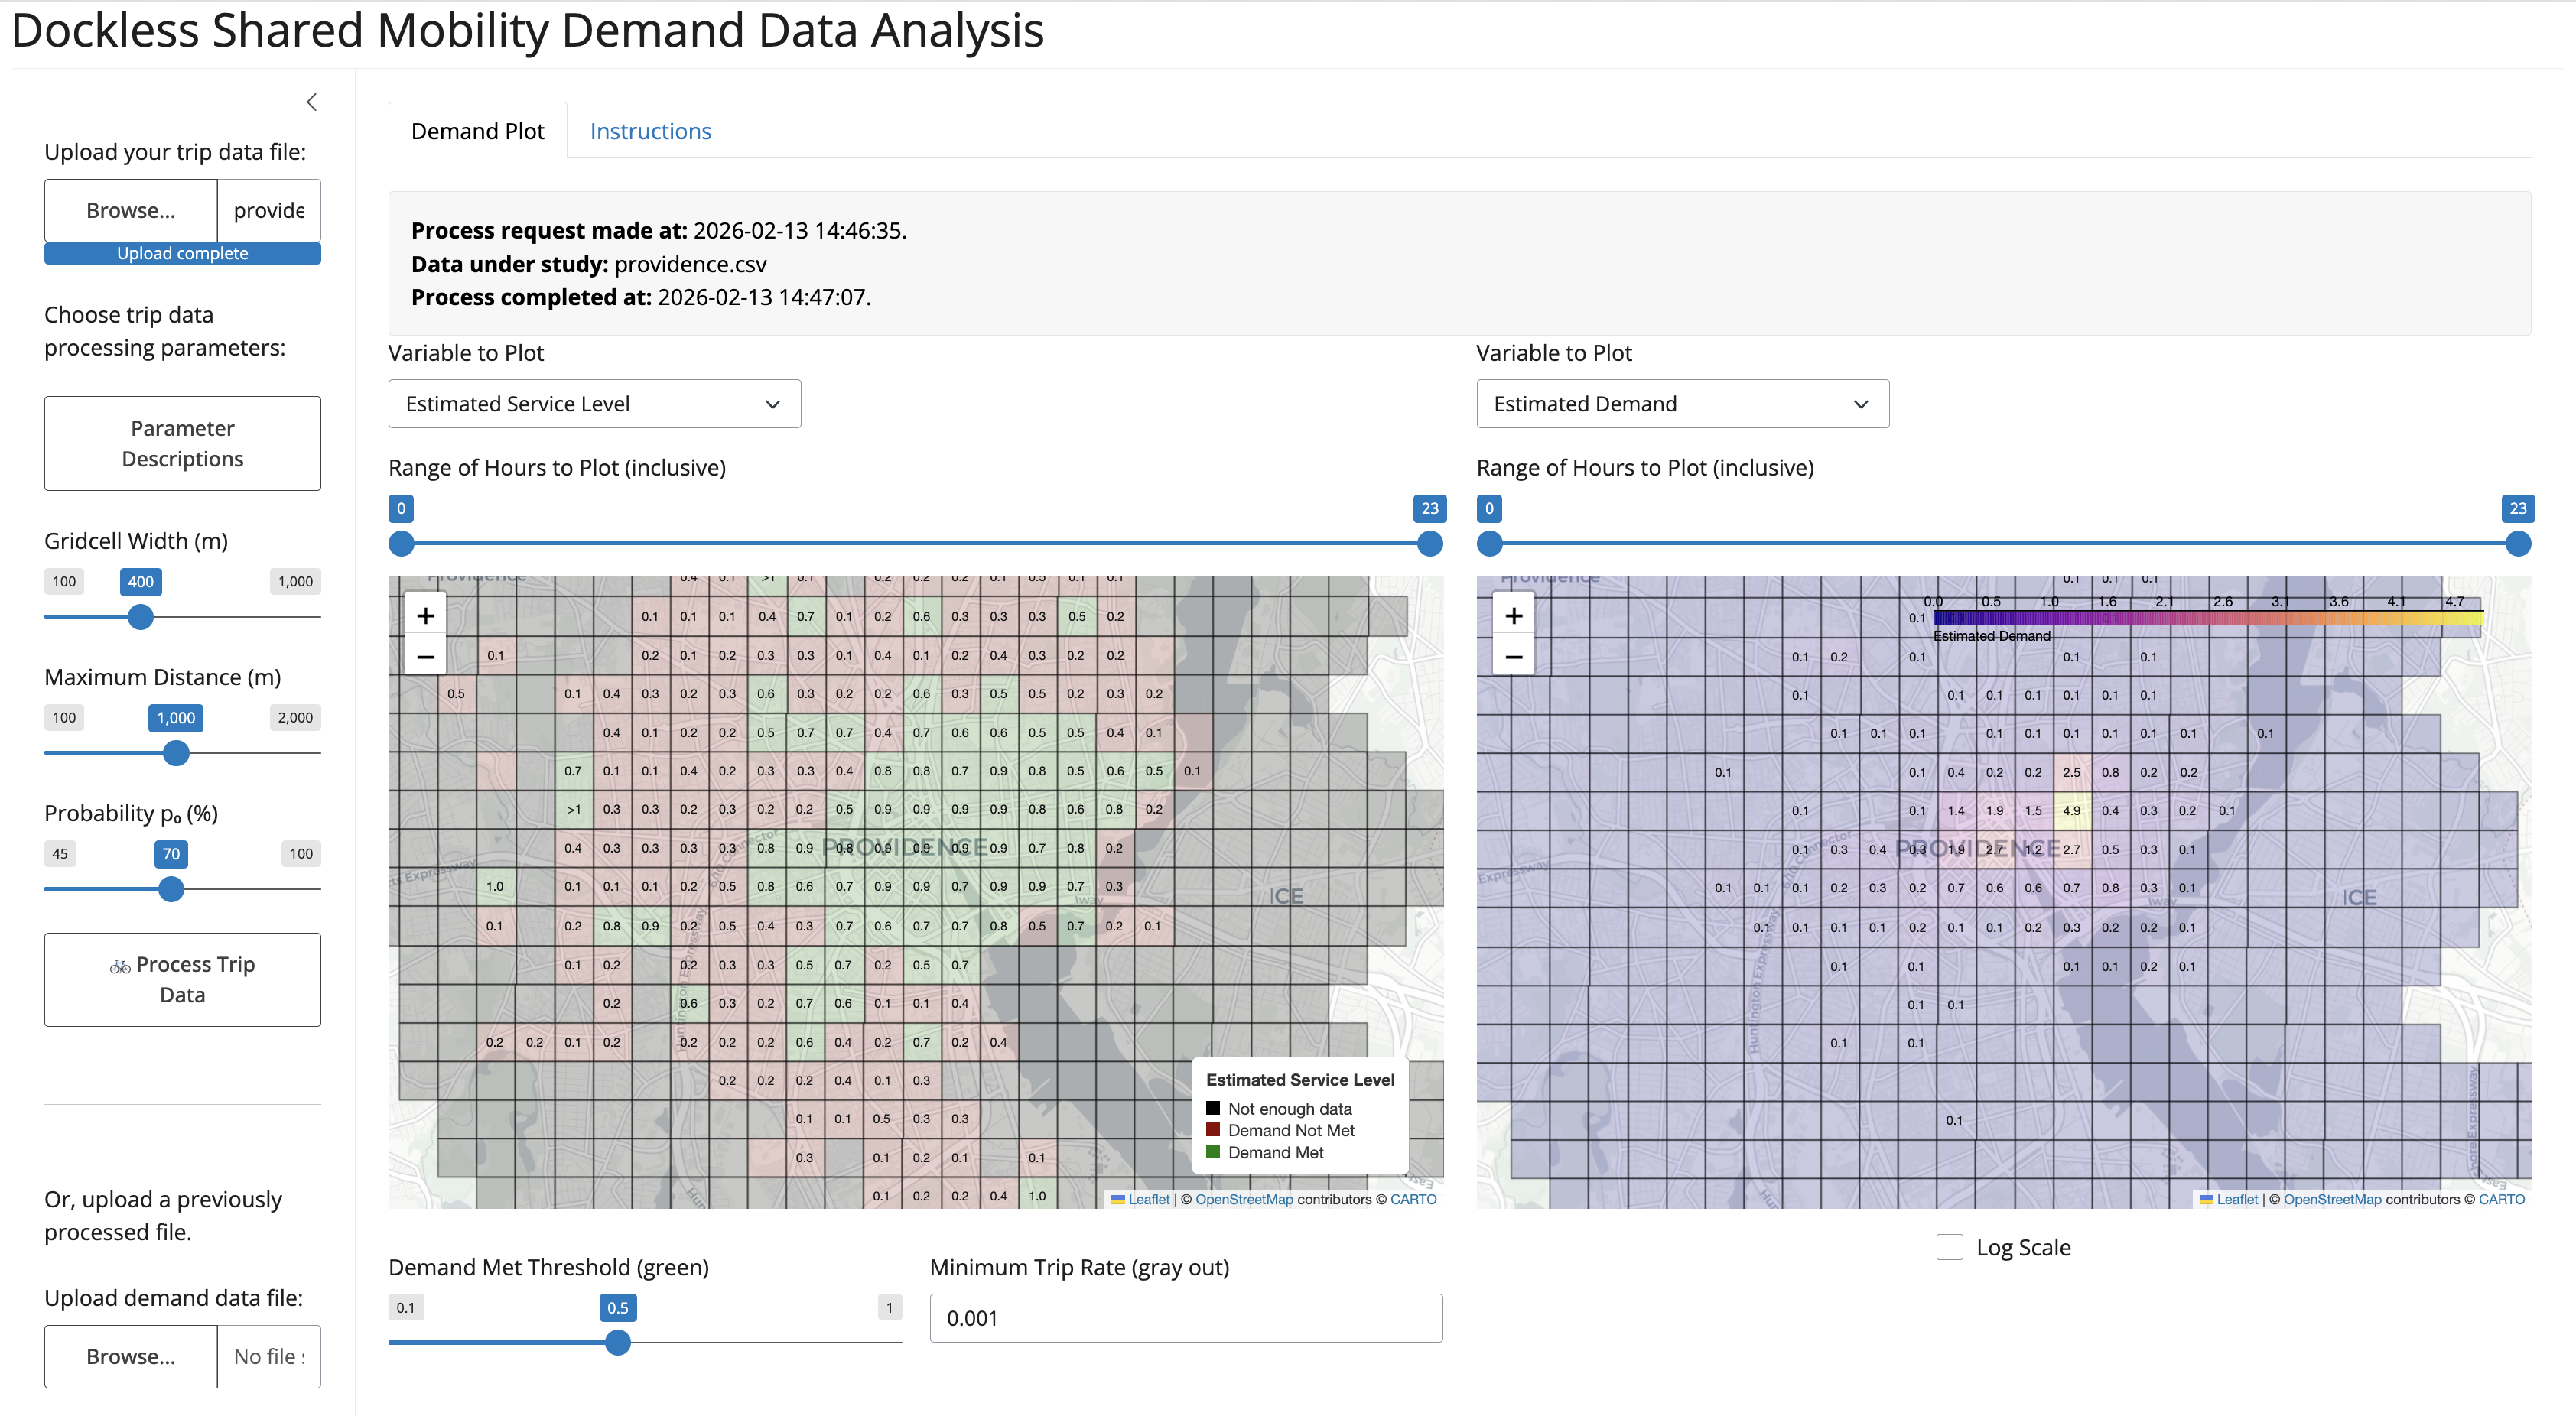
To allow planners to visualize demand heatmaps and explore service gaps, I host the model in an interactive Shiny application, which can be run locally or on our website.
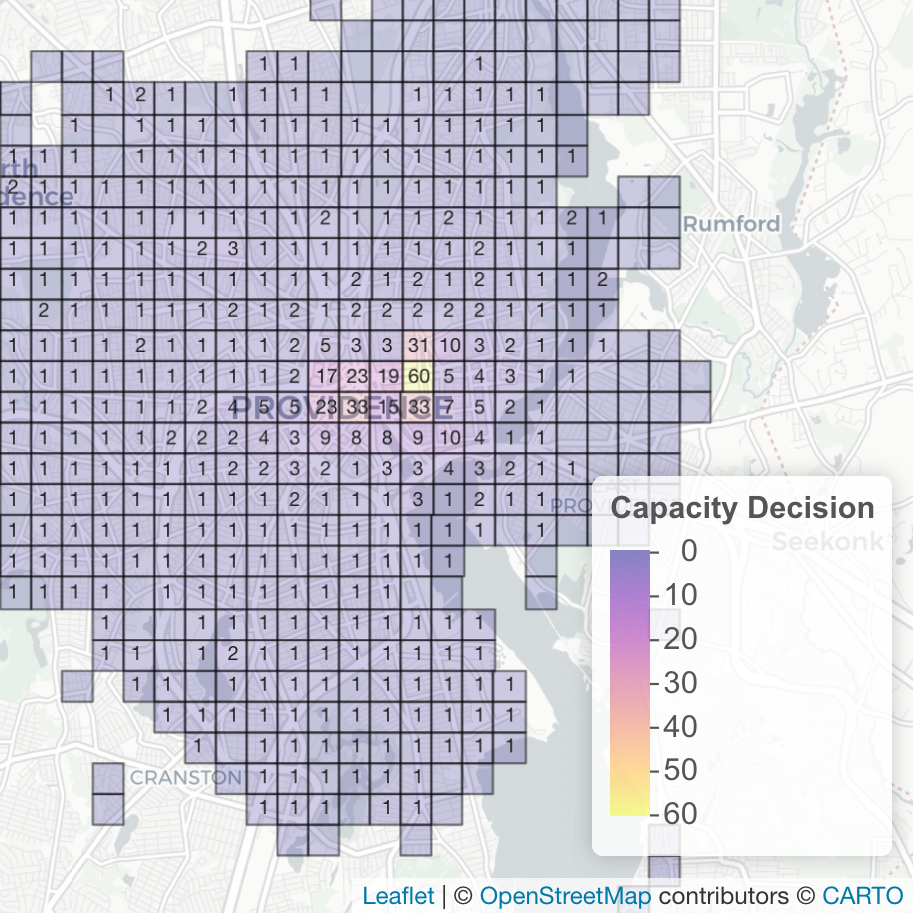
For my thesis, I optimized the daily bike distribution for the Providence given our estimated demand, hinting at the need to further coverage to explore potentially unobserved demand outside of college hill.
I am grateful to have been recognized as a finalist for the INFORMS Undergraduate Operations Research Prize in 2023 for this work!